

Manufactured Housing Communities
Videre Capital MHC ProgramZero percent asset management fees, as usual.
Actively Investing
- Target Returns
- 18% net IRR
- Hold Period
- 10 years
- AUM Target
- $200 million
- Structure
- Joint ventures with institutional and family office partners
Target returns are net of all costs and performance economics, are a target only, and are not a guarantee of future results.
Returns Generated from Operational Improvements, Not Market Beta (Cap Rate Compression)
Strategy returns do not rely on cap rate compression. Quite the opposite: we typically underwrite cap rate expansion. A manufactured housing community is bought at a yield and improved from there. Net operating income is advanced through a defined set of operational levers: occupancy increases, collections discipline, utility submetering, and an expense base improved by AI.
The underwriting follows from that. We underwrite in-place income, and we credit only those improvements we have high confidence can be delivered on the specific asset we are buying. We do not extend assumptions to reach a target return, and a community that requires them is one we decline.
Every community we acquire is brought under a single consumer-facing brand. Videre Communities is the name residents see, and it carries a defined standard of management, maintenance and presentation that each asset is held to. A consistent operating standard is how a fragmented, locally branded sector is assembled into an institutional-quality portfolio, and we regard it as a driver of asset quality alongside the capital we commit to roads and utilities.


Fragmented Ownership Creates Opportunities for Institutional Investors
MHC accounts for roughly one in every twenty homes in America, spread across tens of thousands of communities that were mostly built by Mom & Pops and are still mostly owned by them.
- Manufactured homes in the United States, about 5.4% of all housing stock
7.9M
Manufactured homes in the United States, about 5.4% of all housing stock
- Communities nationally, holding roughly 4.3 million homesites
43,000+
Communities nationally, holding roughly 4.3 million homesites
- National community vacancy through 2025
~5%
National community vacancy through 2025
- Average lot rent growth in 2025 across metros with more than 5,000 homesites
7.9%
Average lot rent growth in 2025 across metros with more than 5,000 homesites
Home and community counts: Source: PGIM Real Estate, Constrained Supply Durable Demand, March 2026. Market estimates, not Videre results. Vacancy and rent growth: Source: Marcus & Millichap, Manufactured Home Communities National Report, 1H 2026. Market estimates, not Videre results.
Insatiable Demand That Will Continue Growing
MHC benefits from strong demand driven by net new demand which is sticky once it is in place.
- 1A manufactured home costs about half what a comparable site-built house costs. That gap widens every year that home prices inflate faster than incomes. Over time, more households (particularly younger ones) will be drawn to ownership within manufactured communities, and aggregate demand rises with them.
- 2Once in place, relocating a manufactured home requires transport, a new site, installation, connections, setup and more. The cost and inconvenience is high enough that most residents simply do not move. Median tenure in a community runs beyond ten years, against roughly six years for a single-family renter.
Affordability and convenience produce low vacancy and low turnover, which is to say income stability. They also produce residents with a long-term interest in the condition of the community they own a home in. Combined with the attractive entry yields available in MHC, this makes it arguably the best asset class in commercial real estate today.
Owns the home, rents the lot
2013
Rents a single-family home
2017
Rents in a building of 2 or more units
2018
Median year the household moved in, as of the 2023 American Housing Survey. Source: PGIM Real Estate, Constrained Supply Durable Demand, March 2026. Market estimates, not Videre results.
Age 55 and over
9.2%
Age 35 to 54
6.6%
Age 20 to 34
1.2%
Projected population growth over the next decade. About 60% of manufactured home owners are already 55 or older. Source: PGIM Real Estate, Constrained Supply Durable Demand, March 2026. Market estimates, not Videre results.
Improve, Then Hold
Most of the work happens in the first two years. After that the community runs, the debt amortizes, and the asset is fully stabilized while generating development-type returns. We set a target hold period of ten years, but we are long-term owners and intend to hold quality assets that compound in perpetuity. That alignment produces better outcomes for residents and investors alike.
Supply Constraints Create a Classic Supply & Demand Imbalance
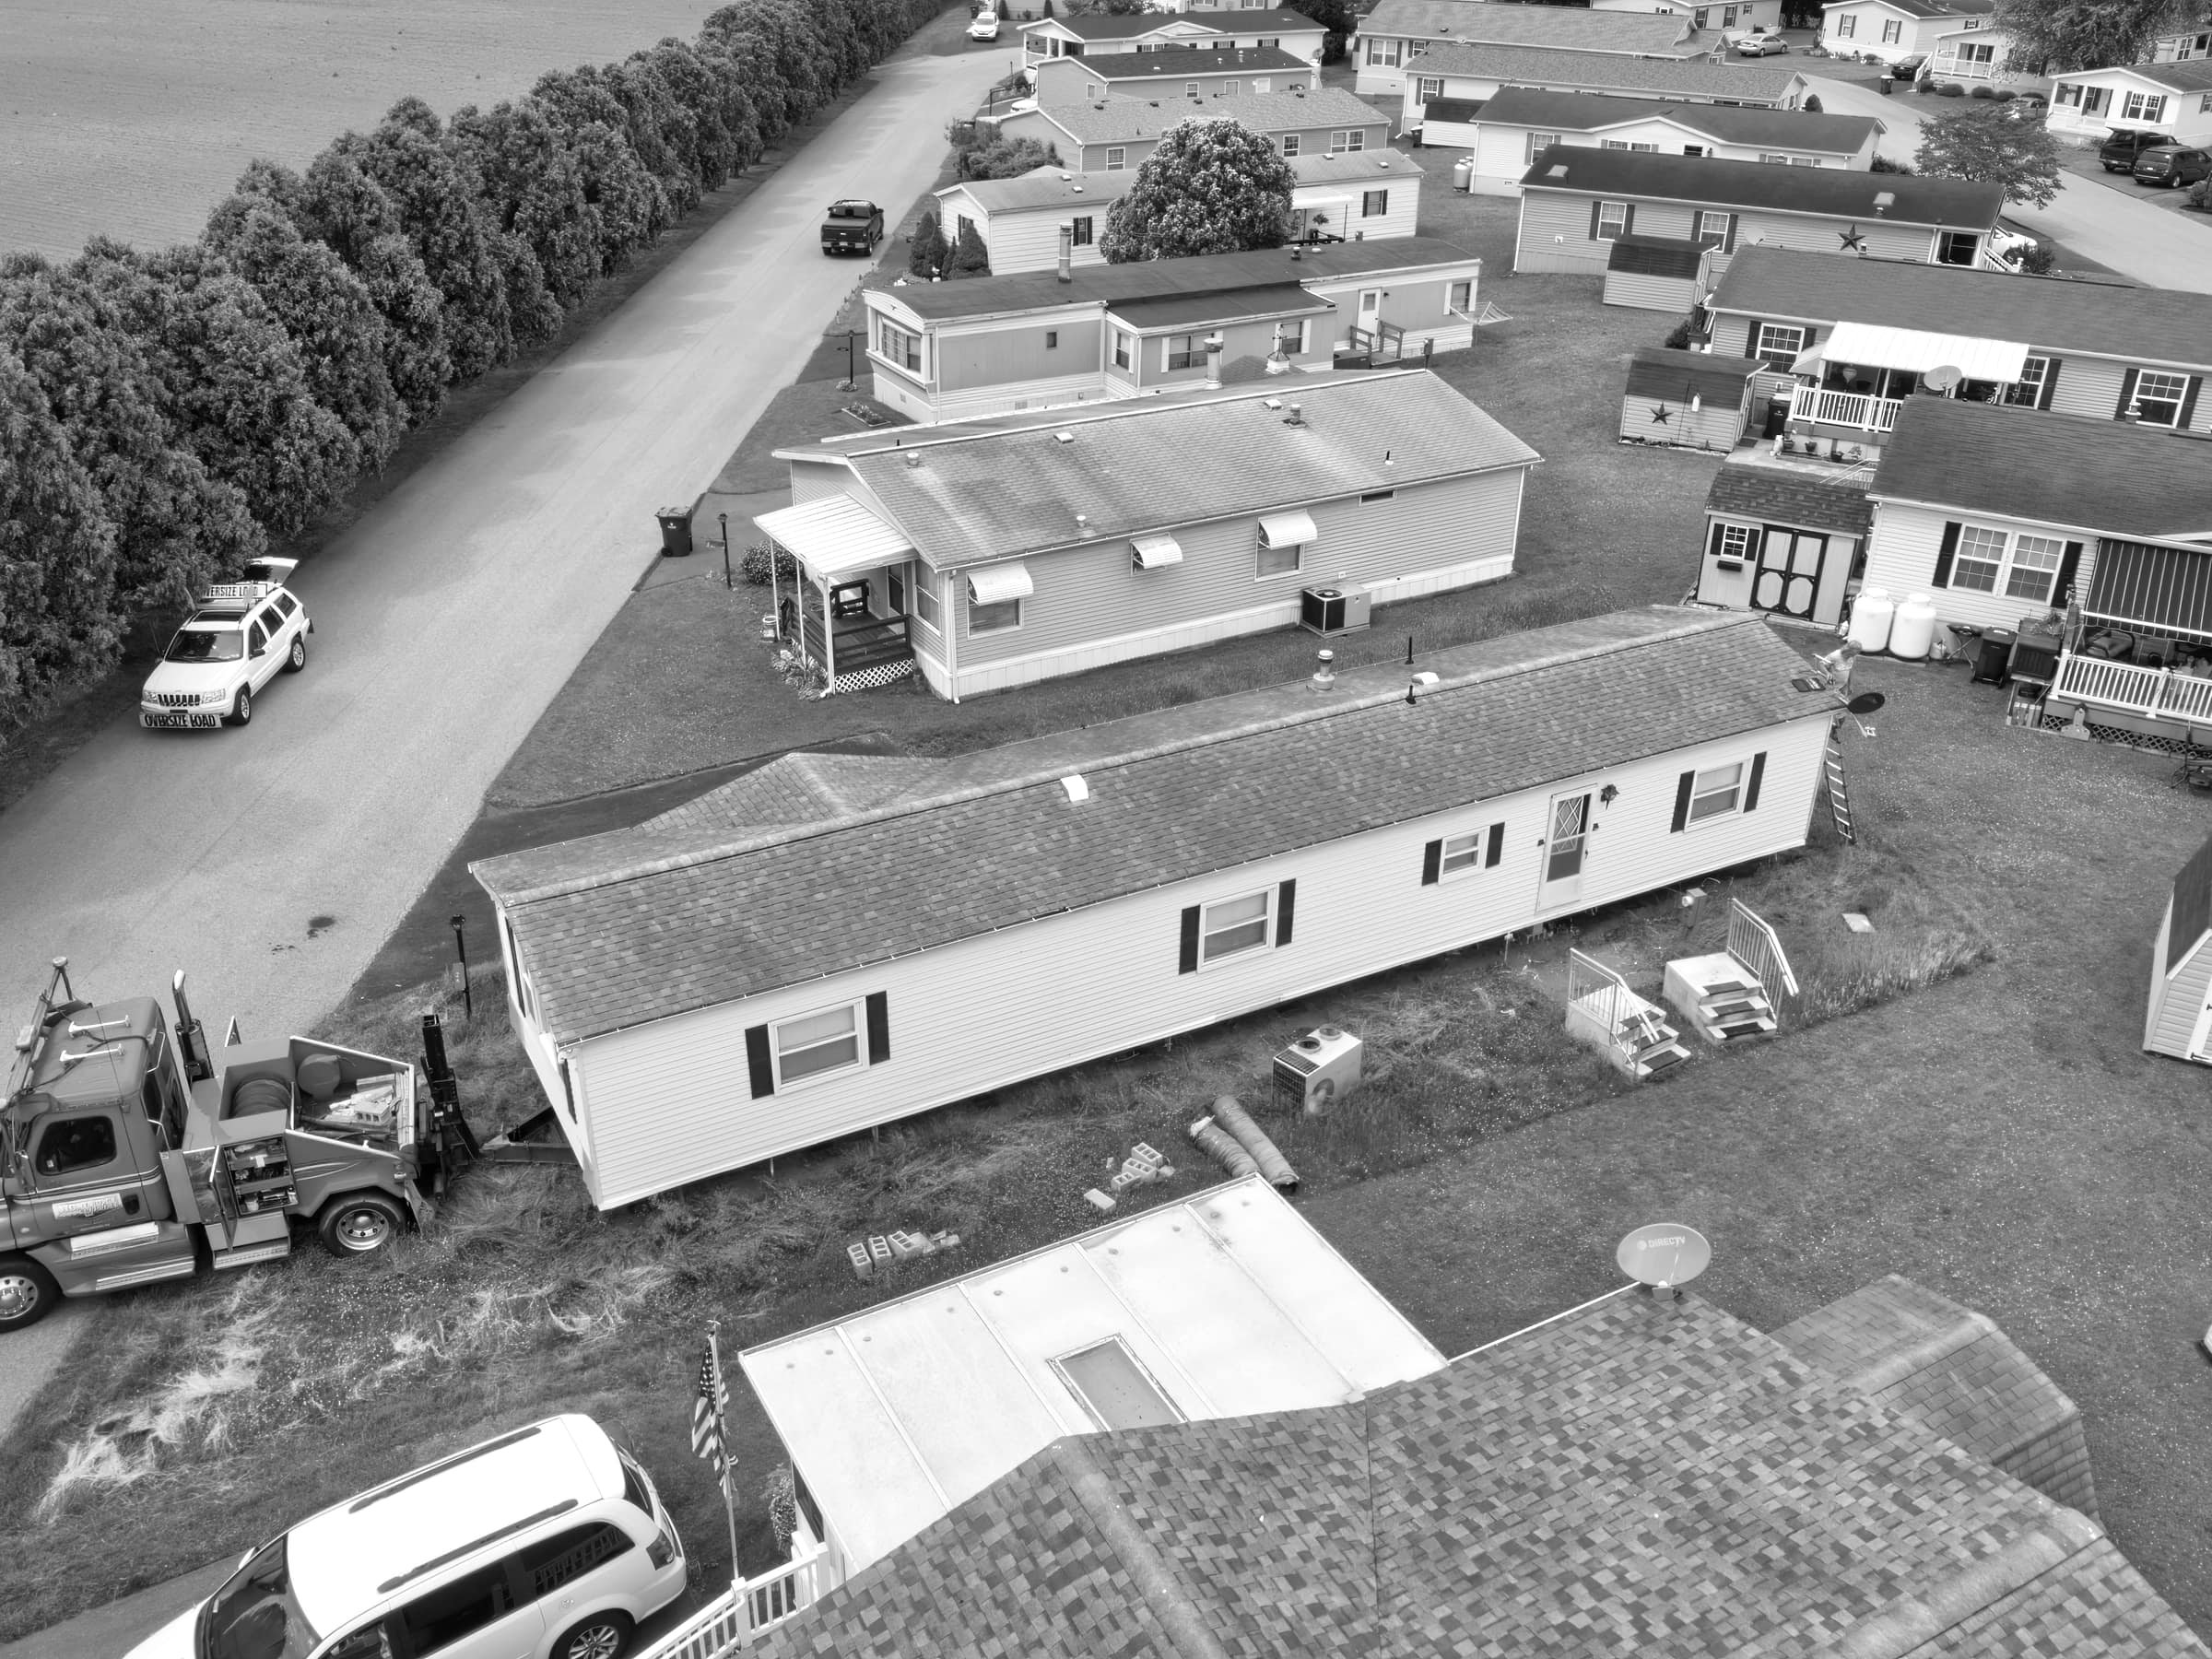
There is almost no jurisdiction in the United States that will approve a new manufactured housing community. Zoning has effectively closed the category. The national stock is fixed and slowly shrinking as older communities are sold to developers and converted to something else. Every community that remains is worth more for that reason alone, and no amount of capital can compete the supply back into existence.
On a net basis the supply of manufactured homes has shrunk since 2000, because new ones have not replaced the ones lost. About half of all surveyed metros recorded a fall in total homesites during 2025 alone. Where somebody does try to build, lease-up runs for years rather than the twelve to eighteen months an apartment takes, which is its own deterrent.
Source: PGIM Real Estate, Constrained Supply Durable Demand, March 2026. Market estimates, not Videre results. Metro inventory: Source: Marcus & Millichap, Manufactured Home Communities National Report, 1H 2026. Market estimates, not Videre results.
Attractive Fundamentals, Even in a Down Market
Since 2000, manufactured housing has produced the strongest NOI growth of any major property type, ahead of self-storage, industrial, apartments, strip centers and office. Even more impressive: that growth stayed positive through recessions, when almost every other property type did not.
It is also cheap to hold. Because residents own the physical homes and the landlord simply owns the land, the roads and the utilities, capital expenditure runs at roughly 7% to 10% of NOI, lower than every property type except self-storage. That translates to higher NOI margins and less management complexity.
Age-restricted, 55 and over
3.2%
National, all communities
5%
All-age communities
6%
Age-restricted communities also hold occupancy far better through downturns: across a sample of Florida markets, all-age occupancy fell roughly 600 basis points from 2005 to 2014 while age-restricted fell 20. Source: Marcus & Millichap, Manufactured Home Communities National Report, 1H 2026. Market estimates, not Videre results. Florida sample: Source: PGIM Real Estate, Constrained Supply Durable Demand, March 2026. Market estimates, not Videre results.
Agency Financing
Fannie Mae and Freddie Mac both run dedicated manufactured housing lending programs. That gives an asset of this size access to long-term, fixed-rate, non-recourse debt that almost nothing else at this price point can reach. Communities that meet the agency standards, meaning paved roads, compliant utilities and mostly resident-owned homes, are financed on terms usually reserved for institutional real estate.
The contrast with how residents finance their own homes is stark, and it is part of why the improvements we make matter. A buyer of a manufactured home typically borrows through a chattel loan, secured on the home as personal property rather than on real estate, at a rate around four and a half points above a conventional mortgage. Federal legislation now moving through Congress would ease several of those constraints.

Where We Buy
We are initially targeting nine high-growth markets across the Southeast and the Sunbelt. We determine attractiveness based on factors such as regulatory regime, supply moat, affordability gap, job base composition, and population growth.
Target MSAs have a “buy” ring around them based on community specifics; the communities worth owning are typically located approximately 60 minutes outside the core. The metro is the demand driver; the ring is where the inventory is.
Trophy Markets
| State | Target MSA | Example Counties |
|---|---|---|
| Texas | Dallas-Fort Worth, San Antonio-New Braunfels | Ellis, Kaufman, Johnson, Parker, Denton, Hunt, Comal, Guadalupe, Bexar |
| Florida | Lakeland-Winter Haven, Ocala | Polk, Pasco, Hernando, Marion |
| Arizona | Phoenix | Pinal, Maricopa |
High-Growth / High-Yield Markets
| State | Target MSA | Example Counties |
|---|---|---|
| North Carolina | Charlotte-Concord-Gastonia | Gaston, Cleveland, Rowan, Cabarrus, Iredell, York, Lancaster |
| South Carolina | Greenville-Spartanburg-Anderson | Greenville, Spartanburg, Anderson, Laurens |
| Georgia | Atlanta | Bartow, Paulding, Barrow, Jackson, Hall, Henry, Coweta, Spalding |
| Tennessee | Nashville | Rutherford, Wilson, Maury, Sumner, Robertson |
Who Else Is Buying
The ownership of this sector is changing hands, and quickly. As recently as 2021 and 2022, private owners accounted for more than seventy percent of transaction volume. By 2025 institutional and private equity buyers were half of it, and the number of deals rose by more than sixty percent against the prior two years.
Pricing followed. Cap rates came in from an average of 7.8% in 2024 to 7.2% in 2025. That compression is the window closing, slowly. It is also worth knowing how early this still is by institutional standards: manufactured housing was only folded into the residential bucket of the main US core real estate index in 2024, and at the end of 2025 it was four tenths of one percent of that index.
- Rise in transaction count in 2025 against the prior two years
+60%
Rise in transaction count in 2025 against the prior two years
- Average cap rate in 2025, in from 7.8% in 2024
7.2%
Average cap rate in 2025, in from 7.8% in 2024
- Share of 2025 volume from institutional and private equity buyers
50%
Share of 2025 volume from institutional and private equity buyers
- Manufactured housing as a share of the main US core real estate index
0.4%
Manufactured housing as a share of the main US core real estate index
Transactions, cap rates and buyer mix: Source: Marcus & Millichap, Manufactured Home Communities National Report, 1H 2026. Market estimates, not Videre results. Index share: Source: PGIM Real Estate, Constrained Supply Durable Demand, March 2026. Market estimates, not Videre results.
Areas We Try to Avoid
- States with punitive regulations, particularly on lot rents.
- Coastal flood exposure.
- Seasonal parks or recreational vehicle resorts.
- Ground-up development.